Scanner Hardware and Sequences
Scanning Hardware
Quote for Grant: MR scanning will be conducted on a research-dedicated Siemens Prismafit 3.0 Tesla imaging system (Siemens, Erlangen, Germany), running XA30 software, and using either a Siemens Head/Neck 20, Head 32, or Head/Neck 64 phased-array coil.
Sequence Overview
Below are some example sequences and parameter sets. Please note the below parameter sets are examples from our old Trio scanner. We are working on compiling a new list of available sequences, with a few typical parameter variations for each. We encourage you to start a conversation with the MRI team to discuss optimizing your sequences for any upcoming study.
Anatomical Scans
T1-Weighted (3D MPRAGE)
T1-weighted 3D MPRAGE is the standard scan used to image brain anatomy. It provides good contrast between gray and white matter, and can produce very high resolution (~0.8-1mm) making it useful in identifying various brain structures. The results obtained from functional scans are usually overlaid on this scan to identify brain structures associated with the given functional task
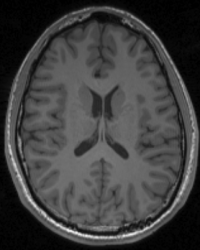
Example Parameter Values: T1-weighted 3D-MPRAGE image (TI/TE/TR=1100/2.63/2000 ms, FOV=256×192 mm, 256x192x160 acquisition matrix, 1x1x1 mm3 voxels, scan time = 6:26′)
NOTE: A version with sagittal oriented slices is also available; this is particularly useful when the anatomical is needed to localize (for proceeding scans) structures more easily seen in the sagittal plane
T2-Weighted (2D Obl TSE R High Res)
T2-weighted turbo spin echo (TSE) can produce very high resolution T2-wieghted images within a reasonable scan time. In T2-TSE images, both fat and water are hyperintense and appear bright.
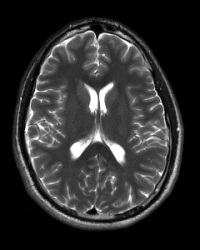
Example Parameter Values: T2-weighted image (interleaved axial multi-slice dual turbo spin echo, TE/TR=68/3000 ms, FOV=220×220 mm, 512×512 acquisition matrix, 28 slices, 0.4×0.4×3.0 mm3 voxels, GRAPPA acceleration factor=2, scan time=6:08′)
Proton Density/T2 Weighted (2D)
This scan will produce both proton density- (PD) and T2-weighted images within the timing of one scan. Assuming both contrast mechanisms (PD and T2) are desired, this scan is then particularly useful when minimizing scan session length is a priority, while allowing for a reasonably high resolution T2 acquisition (given the same scan time, the PD/T2 weighted scan will not be able to achieve as high of a resolution as the T2 only weighted scan).
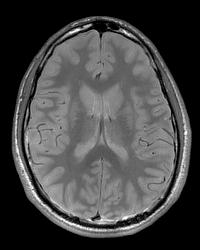
Example Parameter Values: T2-weighted image (interleaved axial multi-slice dual turbo spin echo, TE1/TE2/TR=19/93/3000 ms, FOV=224×185.5 mm, 256×212 acquisition matrix, 44 slices, 0.9×0.9×3.3 mm3 voxels, GRAPPA acceleration factor=2, scan time=6:38′)
T2-FLAIR
The T2 fluid attenuated inversion recovery (FLAIR) scan is a T2 scan with an inversion recovery sequence added to suppress the hyperintense CSF signal. This is particularly useful when imaging structures close to the ventricles (e.g. MS lesions).
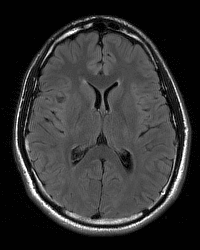
Example Parameter Values: fluid attenuated inversion recovery (FLAIR) image for T2-weighted image without cerebrospinal fluid contamination (TE/TI/TR=96/2500/9000 ms, FOV=224×185.5 mm, 256×212 acquisition matrix, 0.9×0.9×5.0 mm3 voxels, 32 contiguous slices, GRAPPA acceleration factor=2, scan time=3:38′)
DTI
Diffusion weighted imaging (DWI) is sensitive to random molecular movement in a specific direction. By acquiring many DWI images sensitive to different directions, a 3D picture of diffusion at a particular point in tissue can be created; this is what diffusion tensor imaging (DTI) consists of. DTI is often used to assess/diagnose acute stroke and to image white matter fibre tracts.
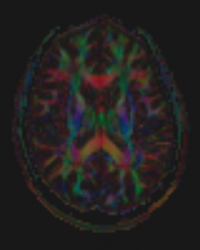
Example Parameter Values: diffusion-weighted image with interleaved multi-slice 2D spin-echo EPI acquisition (30 directions, 4 b=0 volumes, TE/TR = 84/7900 ms, FOV = 242×242 mm, 110×110 acquisition matrix, 68 slices, 2.2×2.2×2.2 mm3 voxels, 6/8 partial-Fourier, GRAPPA acceleration factor=2, scan time = 4:40)
NOTE: 60 direction (4 or 6 b=0 volumes) scan also available; 2mm3 resolution available on 32 channel coil
SWI (Susceptibility Weighted Imaging)
Susceptibility weighted images (sometimes called BOLD venographic images) consists of magnitude images that are multiplied by a filter which has been determined from the corresponding phase images. This in part provides contrast to susceptibility effects, particularly venous blood, hemorrhages, and iron storage. This type of scan is often used to obtain high resolution brain venographies, as well as for traumatic brain injuries.
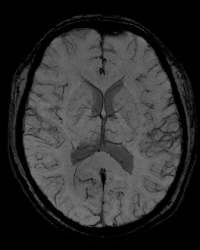
Example Parameter Values: 3D susceptibility-weighted image (TE/TR = 20/28 ms, FOV = 224×168 mm, 448x336x112 acquisition matrix, 0.5×0.5×1.2 mm3 voxels, GRAPPA acceleration factor=2, scan time = 10:43’)
Functional Scans
BOLD fMRI
By far the most common sequence for functional MR imaging, BOLD fMRI is sensitive to the blood oxygen level dependent signal which increases with local brain activation, essentially allowing one to localize brain regions activated by specific stimuli. Most BOLD fMRI scans are run using gradient-echo echo planar imaging (GE-EPI) and therefore are particularly sensitive to artifacts in regions of interest typically affected by susceptibility effects (e.g. medial orbitofrontal cortex, temporal poles, inferior temporal lobe). Spin-echo EPI is an alternative fMRI sequence that, though it is not as sensitive to the BOLD signal as GE-EPI, is not affected by susceptibility effects making it particularly advantageous when one’s ROI lies in those areas typically affected by susceptibility.
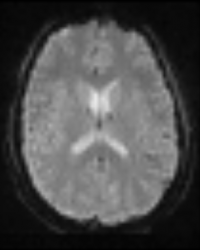
Example Parameter Values: functional MRI using axial oblique, ascending interleaved, multi-slice gradient-echo (GE) echo planar imaging (EPI) (TE/TR=30/2000 ms, FOV=200×200 mm, 64×64 acquisition matrix, 3.1×3.1×5 mm3 voxels, 30 slices, ___ time points, scan time = _:__’)
Pulsed ASL (PASL)
Pulsed arterial spin labelling (PASL) functions by magnetically labelling blood with an RF pulse, and then imaging the brain once this blood has perfused into it. Labelled and control images (images for which labelling has not occurred) are continuously taken on after the other for the requested amount of time; the subtraction of label and control images then provides a signal which is proportional to cerebral blood flow (CBF). To obtain quantitative CBF values, a short (~1min) calibration scan must also be carried out.
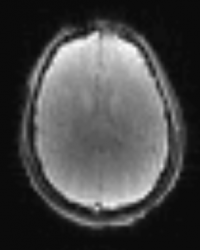
Example Parameter Values: PICORE Q2TIPS pulsed ASL, ascending interleaved multi-slice 2D-EPI acquisition with axial oblique slices (TE/TR=13/3000 ms, FOV=224x224mm, 64×64 acquisition matrix, 3.5×3.5×5 mm3 voxels, 26 slices, TI1/TI1s/TI2 = 700/1600/1800 ms, gap = __ mm, GRAPPA acceleration factor=2, __ time points, scan time = _:__’); a 2D EPI calibration scan was collected at a TR of 10 s
Dual Echo Pseudo Continuous ASL (DE-pCASL)
This dual echo scan acquires both pseudo-continuous ASL, as well as BOLD images within the same TR (the TR will generally be longer than a standard BOLD sequence so as to accommodate both image types). It should be noted that due to the magnetic labelling of the ASL component, the BOLD images require a few extra steps in the pre-processing before being analyzed to localize activation. This sequence is particularly useful if simultaneous CBF/BOLD measurements are of interest, or if minimizing scan time is a priority (i.e. running one DE-pCASL scan instead of a separate ASL and BOLD scans).
Example Parameter Values: dual-echo pseudo-continuous ASL, ascending interleaved multi-slice EPI acquisition with axial oblique slices (TE1/TE2/TR=10/25/3520 ms, FOV=220×220 mm, 64×64 acquisition matrix, 3.4×3.4×5 mm3 voxels, labeling duration = 1500 ms, post-labeling delay = 1000 ms, GRAPPA acceleration factor = 2, __ time points, scan time = _:__’); a calibration scan was collected at a TR of 10 s
If you have questions please contact Jacob Matthews.